Bullet Chart
Overview
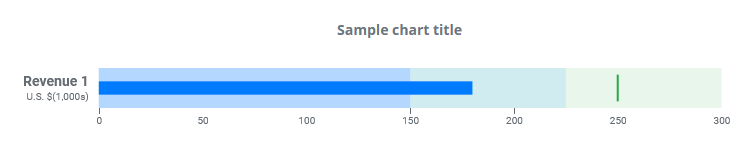
This chart type visualizes a measurement and compares it one or more other measurements. It helps you to compare a target value to the current value and the current value to three ranges designating a low, a medium and a high performance range. The chart is visualized as a horizontal bar split into three ranges with different colors. From left to right, ranges denote low, medium and high values, respectively. In the center of the chart, a bar extends from left to right, denoting the current value. A vertical line designates the place of the target value on the chart.
Customization
You can specify the color of the ranges, as well as the color of the bar.
Features
| Lasso | Brush | Zoom | Dot Tooltip | Line Tooltip | Simple Tooltip | Custom Tooltip | Click event | |
|---|---|---|---|---|---|---|---|---|
| BulletChart |  |
|
|
 |
|
|
|
|
Example
Creating a simple Bullet Chart