Population Pyramid Chart
Overview
A population pyramid is a chart that enables you to compare two different data sets. Consequently, the chart must have two data series. Data series are displayed as horizontal bars. A population pyramid is a horizontal chart with a vertical X axis and a horizontal Y axis. The X axis is displayed in the center of the chart, with the data series’ bars extending to the left and right.
Customization
Series colors are automatically determined. You can also modify these colors to set the desired color scheme.
Features
| Lasso | Brush | Zoom | Dot Tooltip | Line Tooltip | Simple Tooltip | Custom Tooltip | Click event | |
|---|---|---|---|---|---|---|---|---|
| PopulationPyramidChart |  |
|
|
 |
|
|
|
|
Example
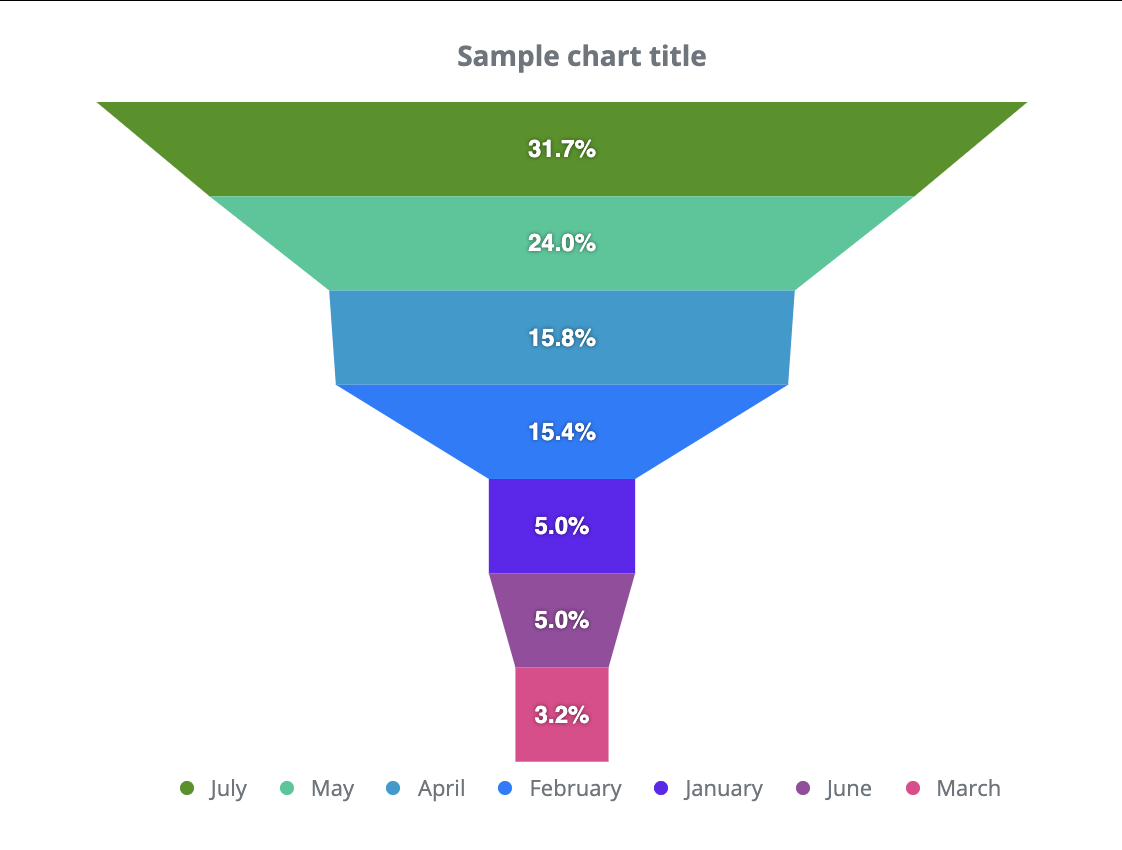
Creating a simple Funnel Chart