Funnel Chart
Overview
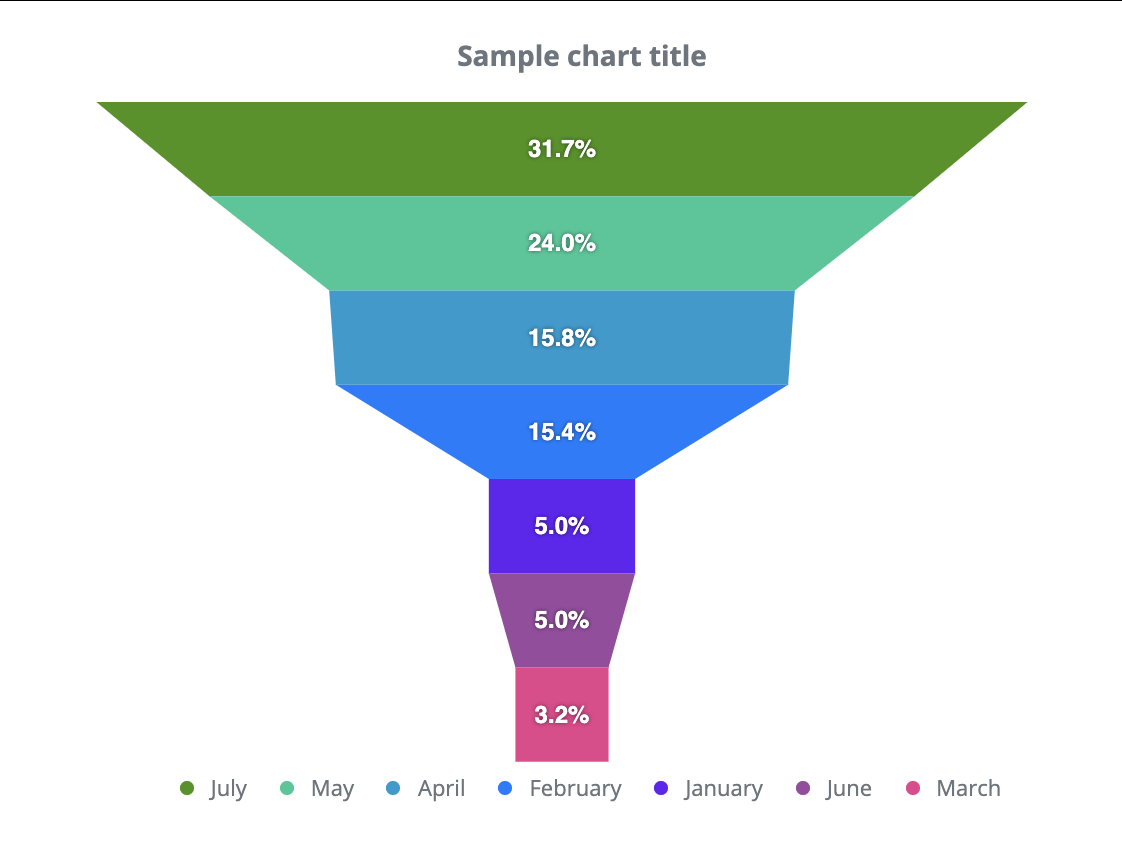
A funnel chart displays one data series. A funnel contains several trapezoid shapes, denoting data points. Every trapezoid shape has a different color (automatically assigned, but can also be specified). The trapezoid denoting the highest value is placed on the top, while other data points are visualized as gradually smaller shapes. The overall outline of the chart has the shape of a funnel. Each trapezoid shape is shown in the legend, helping the user to find out what sort of data the shapes represent.
Customization
You can customize the colors of the chart. You can also create your own custom tooltip.
Features
| Lasso | Brush | Zoom | Dot Tooltip | Line Tooltip | Simple Tooltip | Custom Tooltip | Click event | |
|---|---|---|---|---|---|---|---|---|
| FunnelChart |  |
|
|
 |
|
|
|
|
Example
Creating a simple Funnel Chart