Dot Chart
Overview
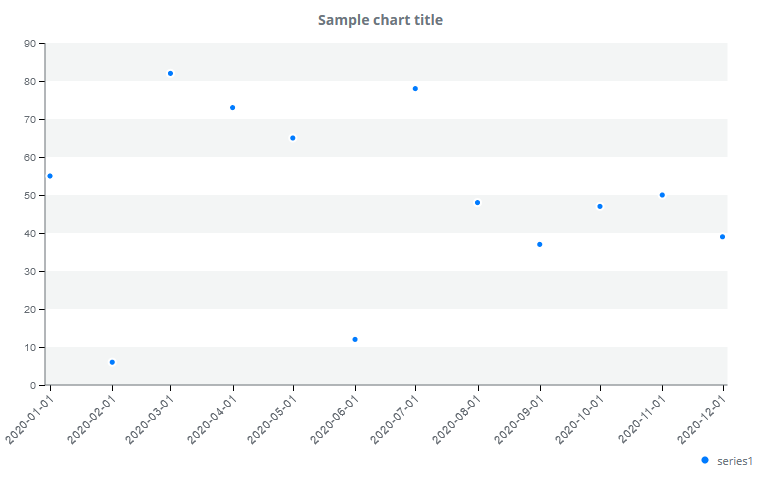
A dot chart is a series of unconnected data points. A chart may contain one or more data series. An area chart is an axis-based chart that has an X and Y axis. Data points are placed on these two axes.
By default, the chart uses the Simple tooltip. Each dot is separately displayed in the legend. The legend shows the user the type of data for each series.
Customization
The dot colors on the chart are automatically assigned, but can also be specified. The data points are colored by series.
By default, the markers on the displayed line show the position of each data point, the color, shape and size of which can be modified. You can also turn off the markers. Once turned off, markers are not visible and thus the click events and tooltips also do not work.
Features
| Lasso | Brush | Zoom | Dot Tooltip | Line Tooltip | Simple Tooltip | Custom Tooltip | Click event | |
|---|---|---|---|---|---|---|---|---|
| DotChart |  |
|
|
|
|
|
|
|
Example